
Consistency of Timbre patterns in Expressive Music Performance
Authors: Barthet M., Kronland-Martinet R., Ystad S.
Publication Date: September 2006
Journal: Proceedings of the International Conference on Digital Audio Effects (DAFx-06) (Montreal, Canada, September 18-20, 2006)
Tags: Musical Interpretation, Timbre
Abstract
Musical interpretation is an intricate process due to the interac- tion of the musician’s gesture and the physical possibilities of the instrument. From a perceptual point of view, these elements induce variations in rhythm, acoustical energy and timbre. This study aims at showing the importance of timbre variations as an important attribute of musical interpretation. For this purpose, a general protocol aiming at emphasizing specific timbre patterns from the analysis of recorded musical sequences is proposed. An example of the results obtained by analyzing clarinet sequences is presented, showing stable timbre variations and their correlations with both rhythm and energy deviations.
Sound examples
A professional clarinettist was asked to play a short piece of music (the beginning of a Bachís Cello Suite) twenty times with the same musical intention.
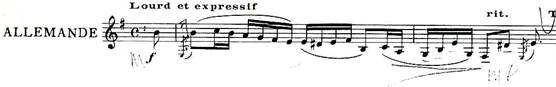
Figure 1 : Score
Play one of the recorded performances
Strong changes of spectral centroid can be observed within the duration of the notes. For example, here is the spectral centroid of the same note N5 (the fifth note of the melody which is a B) for several performances (P15 to P19).
Figure 2 : Spectral Centroid of the fifth note for different performances
For each performance, the spectral centroid of the note globally increases within its duration. This systematic behaviour might be closely related to musical interpretation. One can hear the brightness of the note N5 getting higher within its duration.
We applied signal transformations to the original note to point out these changes of brightness. For that purpose, we forced the spectral centroid to remain stable from the end of the attack part until the beginning of the decay part. The transformation keeps the original attack, decay and intensity envelope of the note. We made two sounds, one for which the spectral centroid is that of the original note close to its beginning (low brightness), and one for which the spectral centroid is that of the original note close to its end (high brightness).
Figure 3 : Freezing the Spectral Centroid
Remarks about the sounds
– The sampling frequency is Fe = 44.1 kHz.
– The sound P15 corresponds to the original recorded performance.
– The other sounds have been produced by using an additive synthesis model with 50 harmonics.